Performance IQ is a tech company that has created a system which allows you to project individual and group performance data onto a screen at the front of the room. You can display power, heart rate, cadence, and more, with the intent to increase individual and class motivation and engagement. I’ve been speaking with the creators of the Performance IQ system for a couple of years and have been following their system with great interest. I first met Tae Yoo and Mark Davids of Performance IQ and rode with their system about two years ago at the Cycling Fusion headquarters in Pittsburgh, PA, for a class I taught that Cycling Fusion streamed live over the Internet. Gene Nacey of Cycling Fusion and I discussed their concept and their ideas for modifications with Tae and Mark over a glass of wine after the class, and I’ve been intrigued ever since. I know they’ve made a lot of positive advancements in their product.
In 2012, Tae dropped by my booth at IDEA to bring me up to date with their progress and growth. It seems like this type of system is really catching on in studios around the world. Then this year at IDEA, he told me about a recent installation of Performance IQ at Break Away Cycle and Strength in Longmont, Colorado. He said Allison, the owner, mentioned she was a follower of the Indoor Cycling Association. Yay! I finally had a chance to experience the system firsthand, while at the same time meeting another ICA member (something I always love to do)!
So, this past Thursday I drove three hours to Longmont, just north of Boulder, to take an evening class with Zack, followed by an early morning class at 5:30 Friday morning with Allison. Before I describe my two classes, watch this short video about BreakAway and the Performance IQ system.
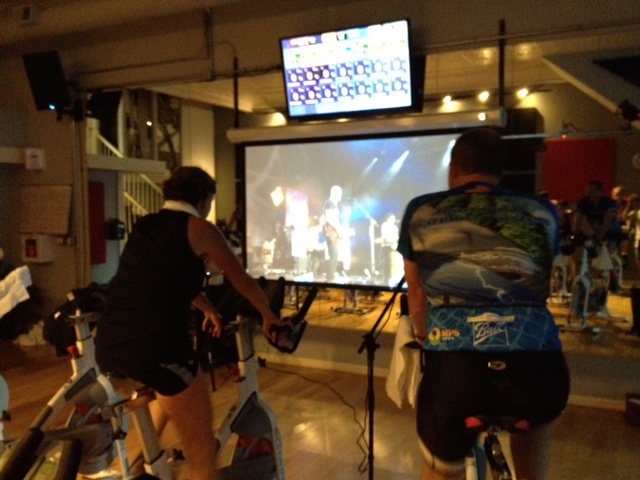
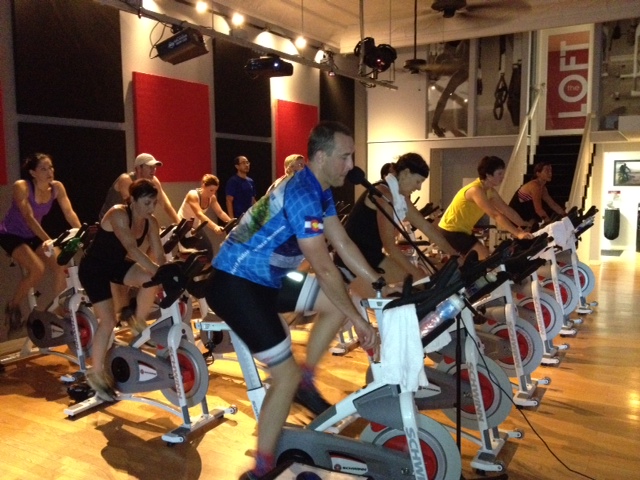
Equipped with one of their Ant+ heart rate monitor straps, I was ready for Zack’s class. He took us on a series of climbs with recovery descents in between. In addition to the Performance IQ (PIQ) screen with was visible on the TV screen, he did something clever with video. During the climbs, he projected live concert videos on the large pull-down screen (see the photo above), while we focused on our power output or heart rate as projected on the PIQ screen. (More on that in a moment.) During the downhills/recovery, he projected several YouTube videos of a unique downhill mountain bike race at Alpe d’Huez, France. (Zack had been to my Alpe d’Huez session at WSSC several years ago. He told me since I took him up the mountain, he was going to take me down the mountain! Here is a sample of this crazy race. Zack had numerous videos from different Go Pro cameras so it was more than just repeating this same image.) It was really a fun distraction. I’ve never been to a class that used video in this way; the combination of the concert and YouTube videos made the class fly by. We will be revisiting Zack and his clever use of video in one of our How to Use Video segments in the future. (That is Zack in the blue in the photo below.)
The next morning (it seemed like only a few hours later), I returned to take Allison’s class. This time it was a 45-minute class followed by a TRX workout for those who wanted to stay. Allison didn’t use video for this class, so she projected the PIQ data on the larger drop-down screen instead of onto the TV screen. She utilized a few features of the PIQ system that were different from what Zack did, so I got to experience several (but not all) of the features. On a side note, before I give my impressions of the PIQ system in both of their classes, I want to thank Allison for her warm-up song. Five-thirty in the morning is the earliest I’ve ever taken a class, and after such a hard workout the evening before, I didn’t sleep well (on a friend’s couch). So when she opened her class with “One Perfect Sunrise” by Orbital, I knew all would be well with the world! 😉
Performance IQ and Power
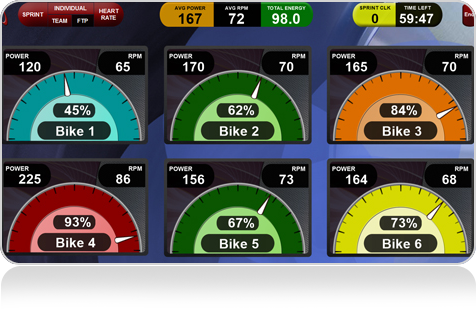
BreakAway has the Schwinn AC Performance bikes with power. Each bike is connected wirelessly to the PIQ system, so you can see your bike on the screen. Both classes I took began with a 3-minute power test at the beginning of class (post warm-up). From that test, it calculates what your PTP would be (Personal Threshold Power, their version of FTP) and the icon on the screen numbered to your bike was based on that PTP. You then ride the rest of the class using zones calculated from that PTP. I have to say mine was very close to what I believe would have been my actual FTP for Zack’s class. How did I know? Because of my perceived exertion and my heart rate threshold were very close to 100% of my PTP from that test. However, because I was so fatigued the next morning, it was much lower for Allison’s class. (I’m not sure if PTP can be stored for each user. I hope it could, so you can enter the results of a 20-minute field test as an option.)
When it’s in power display mode, you can see your own power expressed as a percentage of your PTP. The dial is color-coordinated to correspond to zones in this order: blue, green, yellow, orange, and red. It turns red when you are at 90% of your PTP.
(By the way, the instructor controls the display on the screen from a laptop situated next to the instructor bike.)
Zack did three 12-minute climbs, most of which were held in the orange power zone (80%–90% of PTP). The final 3 minutes of each climb, he had us push to our power threshold and hover around 100%. Several times he asked us to push beyond that. This is the aspect of this system that I found so motivating! When you are looking at that colored meter on the screen, the color becomes your guide. I was working hard to keep mine at 110% for those final 2 or 3 minutes. That represents a very hard effort, but not insurmountable for that short time period. THAT, my friends, is how you improve your strength and power on a climb! There is no faking it, no guessing. Using this kind of coaching and motivation, you will absolutely see an improvement over time if you train wisely.
On the downhill segments, Zack asked us to stay in the yellow zone, which is still a working pace. This is another great way to keep students honest—they can’t sweep away all that resistance when they come off the hill! Sure, there is a time and place for an easier recovery, but this particular profile wasn’t an interval class so it wasn’t necessary. The result is a higher average power, meaning a higher overall caloric burn for this training session. BINGO! That means results.
Class Average Power
In Allison’s class on Friday, she also alternated climbs with flat road work. On the final few minutes of the climbs, she motivated the class in an entirely different way than Zack did. She switched the screen to Class Average Power. Instead of seeing the power numbers for all the bikes, there was only one power number in the middle of the screen, which was an average of everyone in the room. The first time she had us do this, we reached 230 watts for most of it, almost 250 by the end. The second time, she asked us to push for 250 watts much more quickly. And the third time, we all knew what was expected of us. As you rode, you could see the number inching its way upward: 230, 234, 237, 241. You could reach down and tickle the resistance knob so you were working just a little harder, but not enough to blow up. Your contribution to the team effort was discernible by you, and only you.
Once it reached 250, there was a palpable sense of accomplishment that filled the room. This is so different than everyone competing against each other; rather it was a unified effort which was achieved by cooperation and teamwork. There was no way to know who was working harder, but we wouldn’t have reached it if anyone had been slacking!
Heart Rate Module
Zack switched to the Heart Rate Module during his class. While everyone is on a bike that projects their power data (I believe future options will allow riders to opt out if they don’t want it projected), only a handful of riders had heart rate monitors. For each user, their heart rate zones are computed using 220–age. Zack and Allison explained that you can alter the numbers by entering in a different date of birth so that control the zones if by trial and error you determined that your zones were too low or too high.
But I have a better way! I know my field-tested threshold is 161. So I asked them to put that number in as my max (we did that by changing the date of birth so it showed 161 as max HR). Zack wasn’t sure what I was doing, but I told him to trust me…I was bypassing the system.
On the final climb, he wanted the class at about 85% of their MHR, which brought them in the middle of the orange zone. In my case, I pushed until my percentage read 100%. I even went a little higher to 104% (but since I was above threshold, I was really working very hard at that point). Now normally, an instructor might panic if he saw a student riding over her “maximum.” But this wasn’t my max, I was just above my LT. Everyone else was working in a similar range, but the screen read 80%–87% or so. So it worked perfectly!
Now I just need to work with Performance IQ to make sure studios with this fantastic system also have the ability to enter tested threshold. That way, your zones are completely personalized, and not just guessed. Also it offers visual proof when you improve your fitness. Over time, when you can see that you are able to hold 100% of LT without as much discomfort, then it means its time to retest. You’ll probably see that your threshold has increased.
In Summary
Brilliant! I want this system! You can see that even if you have bikes without power you can truly use this system to track fitness and motivate your class.
Can you see the amazing benefits of this kind of motivation? You know how I pick on some of the “fluff” classes that add crunches, pushups, and hand weights? Well, if they had this system and did those kinds of silly moves, they would immediately see how few watts they were actually producing, and hence, less results. But if they just rode the bike correctly, watts would increase (both absolute and average), calories burned would hugely improve, and their fitness would increase exponentially over the fluff workout.
Performance IQ can do so much more than I got to experience. If you are into competition, as many riders are, it has leader boards and other incentives. I know, some instructors feel that indoor cycling is not about competition, but with the incredible success of programs like Strava and Map My Ride/Run, there is no denying that people around the world love it. Your non-competitive students can always opt out of that aspect and focus on the individual motivation it provides. For those that eat it up, you can use it to attract more and more students.
PIQ also has data tracking capabilities to compare over time, and to e-mail data to users. Take a look at their website to see what other great capabilities Performance IQ can offer. They are growing quickly all over the world, so if your facility is looking for a way to set themselves apart from the competition, you might suggest this to your management. And if you give them a call for more information, make sure to tell them ICA sent you!


Hi there, I just recently contracted to teach twice a week at a club that has the polar gx heart rate system. the bikes do not have power meters but do have rpm.
I plan on overriding and having peoples LT # instead of Max HR predictions. any suggestions on profiles that might be a big hit on my first few rides??? I was thinking of some over under type intervals, and later some field tests to refine their LT #s’. I don’t want to field test right off the bat.
suggestions appreciated!!
I remember well that discussion with the founders, Jennifer and I at my house after our live broadcast with their prototype system. I saw this future which is completely different than where they were focused at that time. It is both gratifying and impressive to see them take those ideas we discussed and run with them to bring it to reality.
I’m officially a believer as I’ve also watched them bring this baby from a “pre-mature birth” to a full fledged todler poised to take the rest of the industry to school very soon. Small changes like Jennifer has suggested (ability to enter and store an actual field tested threshold) will continue to separate them from competitive efforts.
In fact, I’ll use this reply to declare Cycling Fusion’s interest to partner with Performance IQ to integrate our patented Class Builder® into their product to make the combination both unbeatable from a functional perspective, but also protected from an I.P. perspective. This could redefine Indoor Cycling as we know it.
Thanks for a fantastic, thorough and inspiring review of their system Jennifer – as always, you are on top of your craft!