There is a silly division between those who train with heart monitors and those who use power meters, as if people either fall into one camp or the other. Because power meters are the latest technology, there is often an attitude that heart rate training is the old way and that power training represents the new. It’s human nature to want to take sides like this, but the theory simply doesn’t hold water.
All of the years of research on exercise physiology where heart rate has been measured have produced a tremendous body of knowledge that can still be put to good use. The effects of training at different heart rates have direct implications for the power you produce and for how you train to improve your power. A number of these implications will be explored throughout this book. Whether you are trying to improve your power efficiency at lower intensities to prepare for an ultra-endurance event, or trying to improve your ability to climb super-steep hills so that you don’t have to dismount when you get half way up the hill, you will be best served by combining both heart rate as well as power in your training routine. Does it make sense then to leave the heart monitor at home just because you now have learned how to train with power? The fact of the matter is that you need to use both tools to train for optimal performance.
The previous chapter on limiters shows that your metabolic systems will dramatically impact on your ability to generate power. It stands to reason then that if you can improve those limiters, you can also put yourself in a position to improve your power.
In an attempt to answer the question, “What is the ultimate workout tool?”, scientists from South Africa’s Sports Science Institute put two devices to the test, and found that a group of hard-core cyclists, who used expensive power meters, barely lost the race to another group of hard-core cyclists who used $50-$100 heart rate monitors. In the head-to-head race, during the four-week test, the power meter riders performed intervals at 80% of peak power, while the heart rate monitor cyclist rode intervals at their 80% heart rate at peak power without a power meter.
The final test was a 25-mile time trial to measure power improvements. Although the results were nearly identical, the heart rate cyclists seemed to have the edge, since they improved power output by 5% versus 2.3% for the power meter riders. Though conventional wisdom favors power meters for training, researchers concluded that one is not better than the other. What is important is that these training tools collect, display, and provide feedback with useful data. More information can be found here.
Although this does not prove that training with a heart rate monitor will help you produce more power than training with a power meter, it does show how closely tied our metabolic system is to power generation. Our goal then, is to use both tools to their respective maximum benefit.
Power at Threshold
Power training discussions often refer to ‘Threshold Power’, or ‘Functional Threshold Power’ (FTP). A more accurate term would be ‘Power at Threshold’. Essentially, this is the highest amount of power you can sustain while you are at your Lactate Threshold (LT). Another way to think about it is as the number of watts you generate as your heart rate reaches threshold, and passes it by on the way to an intense effort.
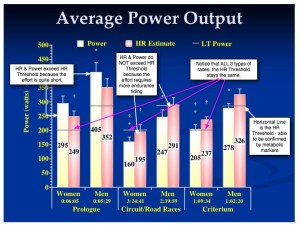
This graphic represents elite or professional athletes. At this level of performance, there are distinct patterns related to gender (males are capable of generating more power than females). However, of particular note is that the horizontal line in the chart that cuts across all power generation exercises validates the fact that our heart rate threshold is a constant number, one value, determined most accurately by metabolic testing. In contrast, the maximum power value is quite different for each type of race (and hence what we refer to as different types of power) that we are required to maintain.

Portions of the above graphic were taken from Saris Cycling Group, Inc. www.saris.com
This also helps to elucidate why heart rate training and testing should be done separately and independently from power testing and training. While HR (Heart Rate) threshold is a trainable number, it will hold steady for a period of time, and apply itself across all different types of racing or riding. Most importantly, though, HR threshold is confirmable by metabolic testing, with physiological markers, unique for every individual. Power, while unique as well, has a different threshold for each different type of cycling effort. The graph above shows this variability.
Heart rate also shows variability, but this is because riders can go ‘above threshold’ for varying lengths of time. It does not, however, change what their threshold is.
Power Differences Between Men and Women
While the graphic above helps to illustrate the small differences between men and women in relation to power, it should be noted that this difference is typically most prominent at the professional or elite level. For the average population some women will have higher VO2 levels than men, and consequently will be able to produce more power as a result. Nevertheless, there are physiological differences that have been studied. Stephen Seiler from the university of Norway states:
“Gross measures of upper body strength suggest an average 40-50% difference between the sexes, compared to a 30% difference in lower body strength. What about power? Maud and Schultz compared 52 men and 50 women, all about 21 years old using a maximal power test on a bicycle ergometer. Peak power was about 60% lower for the females when comparing absolute values. But, the men were heavier. Peak power per kg bodyweight was more similar, 9.3 Watts/kg (4.2 Watts/Lb) vs 7.9 Watts/kg (3.6 Watts/Lb) for the women, an 18% difference. Finally, when power outputs were adjusted for fat-free mass, the values were 10.4 watts/kg. and 9.9 respectively. This 5% was not statistically significant.”


If only we could consistently get all of our riders to embrace the HRM! THEY DON’T. That is why the power training tools are so useful. They’re always there for the using.
Good work here Gene and I’m so glad you’re revisiting some of this stuff during your rewrite. Put me on the pre-order list.
Our power meters are arriving at Cycle Studio Dublin on 15th of Feb. We’re very excited!! We are currently educating ourselves to ensure we are singing of the same song sheet…which will be these posts, your book Gene, a few other pieces of material from Schwinn. We’ll workshop it all with our resident cycling coach before launching them to our customers. Timing couldn’t be better….thanks so much!!
Absolutely Gene, that’s a great idea!
Thank you Gene. Your follow-up is helpful and i look forward to your new chart and power book. I agree with your last comment and am so blessed to say I love what i do so the concept of “work” never enters my thoughts.
Hey Renee, first of all Brava to you for caring enough to put the time and attention to this that you already have. It’s not easy to try and accomodate so many different levels and personal goals in a single classroom setting.
FTP and T2 (FTHR) can be determined in one 20 minute session, although the quasi purist would say you really need a 2X20 to get a reliable FTP (but that can be a recommendation for those motivated to do that on their own). So I think you are covered there.
I struggled and debated with colleagues over the 2 chart system for a year before I put it in my original book, and then continued to be uncomfortable with the “information overload” that ensued, but I couldn’t see a way to not disenfranchise those with much lower power abilities. After Tom Scotto and I dug into it pretty deeply last year, we came up with a single chart, and that one will be coming out in my new Power Book which has been slowly leaking out here on ICA. This time the full PDF suitable for printing will be included in the book so readers and instructors like yourself can print it out. There is overlap in the zones (which was one thing I tried to avoid the last time) but it is actually consistent with how the body behaves and how power is put to use in different circumstances.
Perhaps if Jennifer doesn’t object, I’ll skip ahead and post that chapter next, as it can stand alone without any loss of continuity from the way I’ve written it. I will also make a PDF of the chart available to all ICA premium members free of charge.
Finally, I recommend that you keep your focus on the type of terrain or type of effort you are shooting for in a given class, and then use the power zone and level within that zone, to evoke that kind of physical feeling and produce that kind of riding experience. For example, if I’m building a class (or just a portion of a class) around rolling hills, I can point to a range of power that would allow us to keep a comfortable pace without scrubbing too much speed through those rollers. I’m sure you can come up with a number of scenarios as well.
Good luck, and keep up the good attitude (it never feels like “work” when you love what you do) 🙂
Thank you Gene.
to clarify… when testing my riders I should test their FPT in a separate session from FTHR? in the Stages testing protocol both are calculated in one testing session.
i’ve struggled a bit in class when giving zones for focus of FTHR or FTP and then combine that with the indoor/outdoor power chart and that is info. overload and confusion. I have a very wide range of abilities coming to class. some have had a FTP/FTHR test with me, some outdoor riders and racers others only indoor. how should i best plan my rides and give a focus to cover the variety of riders?
Would the initial focus of FTHR be best then add the FTP power component found within those zones and then add Cycling Fusion Indoor/Outdoor Power Chart guidelines? Would it be better to change it up each week which is what i have been doing?
thanks for the tips.